Understanding podcast statistics.
Downloads, listeners and retention rate: what the numbers mean and which ones really count.
You open your host’s statistics and see a number for your new episode. Spotify shows a completely different one, and Apple shows you something else again. So which one is right?
All of them, they just measure different things. Your host counts downloads across all platforms, while Apple, Spotify and YouTube only count what happens in their own app, but in return know how long people really listened. To see whether your podcast works, you only need three numbers in the end. The retention rate, meaning how long your listeners stay with an episode, listeners per episode, and the trend over the last 90 days.
In this article I show you what is behind the individual podcast statistics, where to find them, when a number is good and what my team and I look at with our clients.
What do downloads, plays and listeners mean?
The terms sound similar but measure completely different things. A download only means that an episode was loaded onto a device. A play means someone pressed play. And a listener is a single device or account, no matter how often it plays.
| Metric | Who counts it | What it tells you |
|---|---|---|
| Download | your host, OP3 | An episode was downloaded in full or in part, often automatically. Whether anyone listens, nobody knows. |
| Play | Apple, Spotify, YouTube | Someone pressed play. Spotify has counted plays only from 30 seconds since June 2026, Apple every press of play. |
| Listener | Apple, Spotify, OP3 | Individual devices or accounts. Someone listening on phone and laptop can count twice. |
| Engaged listeners | Apple | Listeners who heard at least 20 minutes or 40 % of an episode. |
| Retention rate | Apple, Spotify, YouTube | What percentage of your listeners are still there at each point of an episode. |
| Followers | Apple, Spotify | People who subscribed to your podcast and get new episodes automatically. |
Definitions according to Apple, Spotify and IAB Tech Lab. The platforms keep changing their metrics.
Why downloads are not the same as listeners
If an episode has 2,000 downloads, that does not mean 2,000 people listened to it. Many apps automatically download new episodes for followers, even if they never press play. At the same time, Spotify and YouTube partly play episodes from their own servers, so not every play reaches your host.
So that downloads are comparable at all, there are the measurement guidelines of the IAB Tech Lab, currently in version 2.2. According to them, a download only counts once at least one minute of the episode has been loaded, and several requests from the same device within 24 hours count only once. Hosts certified under these guidelines therefore deliver similar numbers, but not exactly the same. If you switch hosts, your numbers change slightly without anything having changed about your audience.
Where do you find your podcast statistics?
Your numbers live in several places, and none of them shows you everything. Your host sees all platforms, but only downloads. Apple, Spotify and YouTube only see their own app, but in return know how long and at which point people really listened.
| Source | What you see there | Applies to |
|---|---|---|
| Your host | Downloads, countries, apps and devices | all platforms combined |
| OP3 | independently counted downloads and listeners, free | all platforms combined |
| Apple Podcasts Connect | Plays, listeners, engaged listeners, followers, retention per episode | Apple Podcasts only |
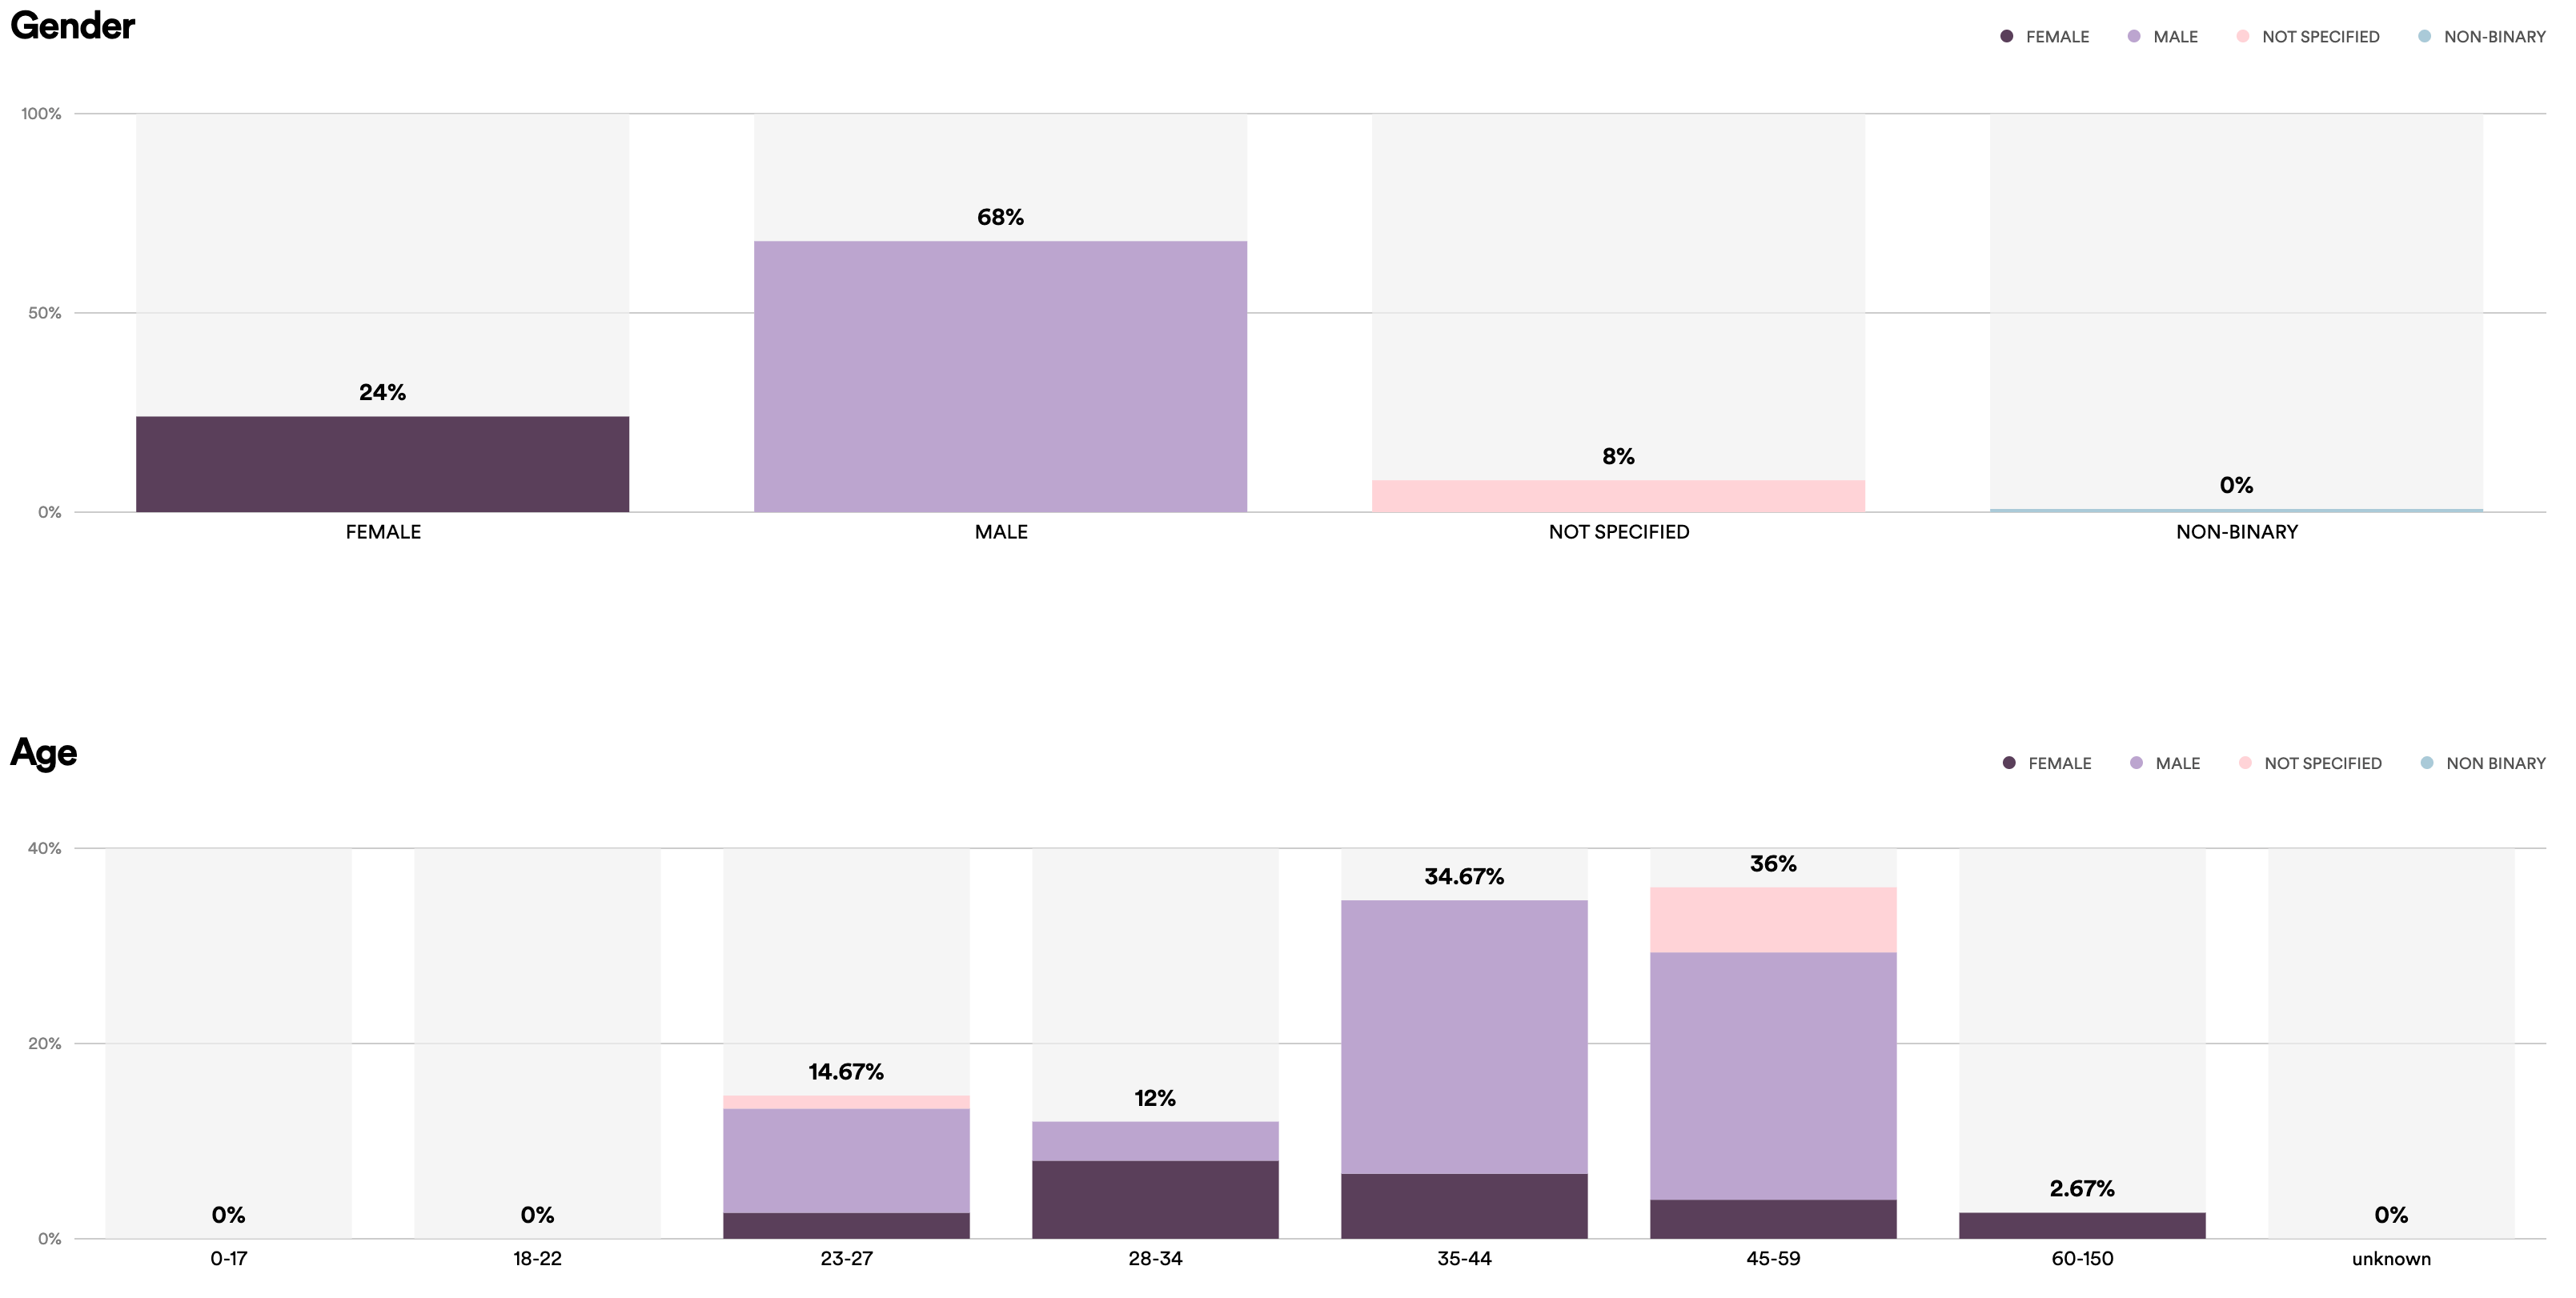
| Spotify for Creators | Plays, listening time, followers, impressions, age, gender, retention | Spotify only |
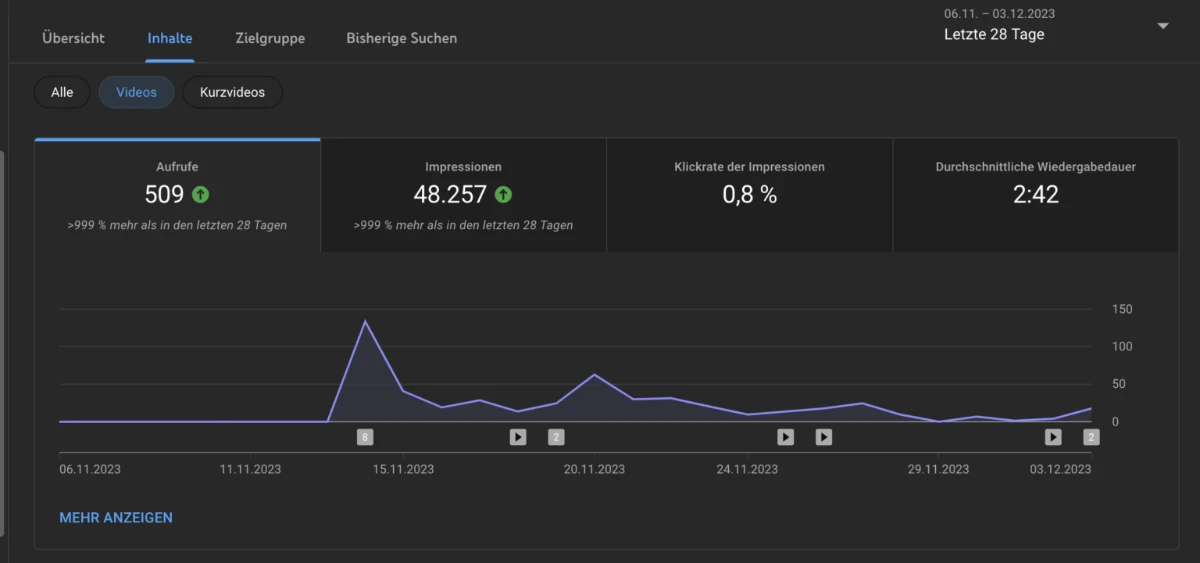
| YouTube Studio | Views, watch time, audience retention, impressions, click-through rate | YouTube and YouTube Music only |
Apple Podcasts Connect, Spotify for Creators and YouTube Studio are free. How many statistics your host shows often depends on the plan. As of October 2026.
Your host’s statistics
Your host is the only place where you see all platforms together, including smaller apps like Overcast, Pocket Casts or Podcast Addict. It is therefore your main source for total reach. Check whether it measures certified under the IAB guidelines. Which hosts exist and how they differ is in the article on podcast hosting providers.
OP3 as an independent second opinion
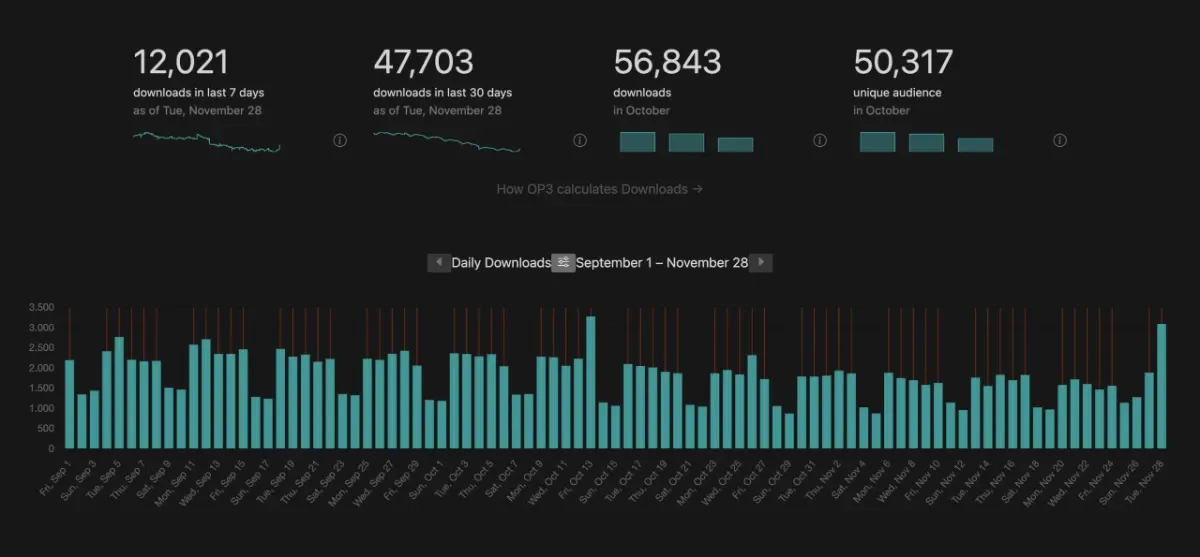
OP3, the Open Podcast Prefix Project, is a free service you put in front of the addresses of your audio files. It then counts every request independently of your host and shows downloads and listeners openly. The cover image of this article is such an OP3 analysis.
The statistics in Apple Podcasts Connect
In Apple Podcasts Connect you see what happens in the Apple Podcasts app, and not downloads but real plays. Apple shows you plays, listeners, followers, total listening time and average consumption, meaning how much of an episode was heard per device on average.
The most interesting number is engaged listeners. Apple counts everyone who heard at least 20 minutes or 40 % of an episode. Whoever gets that far has deliberately chosen your episode. By the way, Apple only shows data once at least five listeners have played something in the selected period.
The statistics in Spotify for Creators
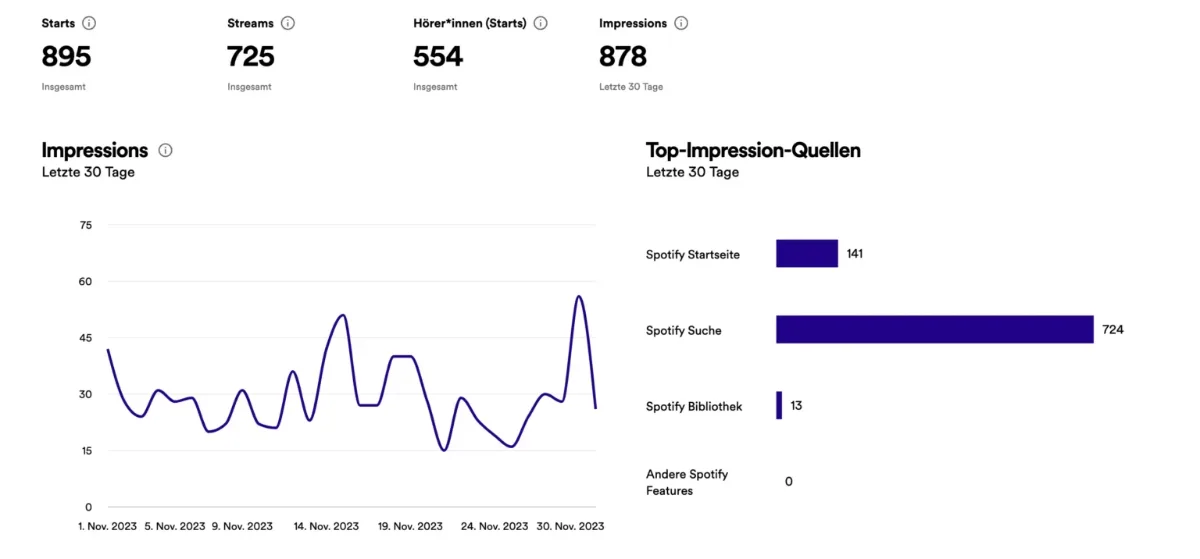
The former app Spotify for Podcasters has been called Spotify for Creatorssince late 2024. There you see plays, listening time, followers, age, gender and country of your listeners and, very handy, impressions. Those are the moments your podcast was shown on Spotify, whether or not anyone clicked. That lets you tell whether people find you via search, the home page or their library.
Important for anyone comparing their numbers over a longer period. Since June 11, 2026, Spotify counts a play only once at least 30 seconds have been listened to or watched. Behind that is a new definition by the industry alliance AMP (Alliance for Measurement in Podcasting). Your Spotify numbers can drop as a result without you having lost a single listener. So do not compare periods before and after June 2026 directly with each other. The earlier metric “starts” was already removed by Spotify in May 2025.
The statistics in YouTube Studio
If you also publish your podcast as video, YouTube Studio gives you the most detailed data of all. You see views, watch time, average view duration, impressions and the click-through rate, meaning how often people see your thumbnail and how often they click on it. The click-through rate in particular shows you whether title and thumbnail work.
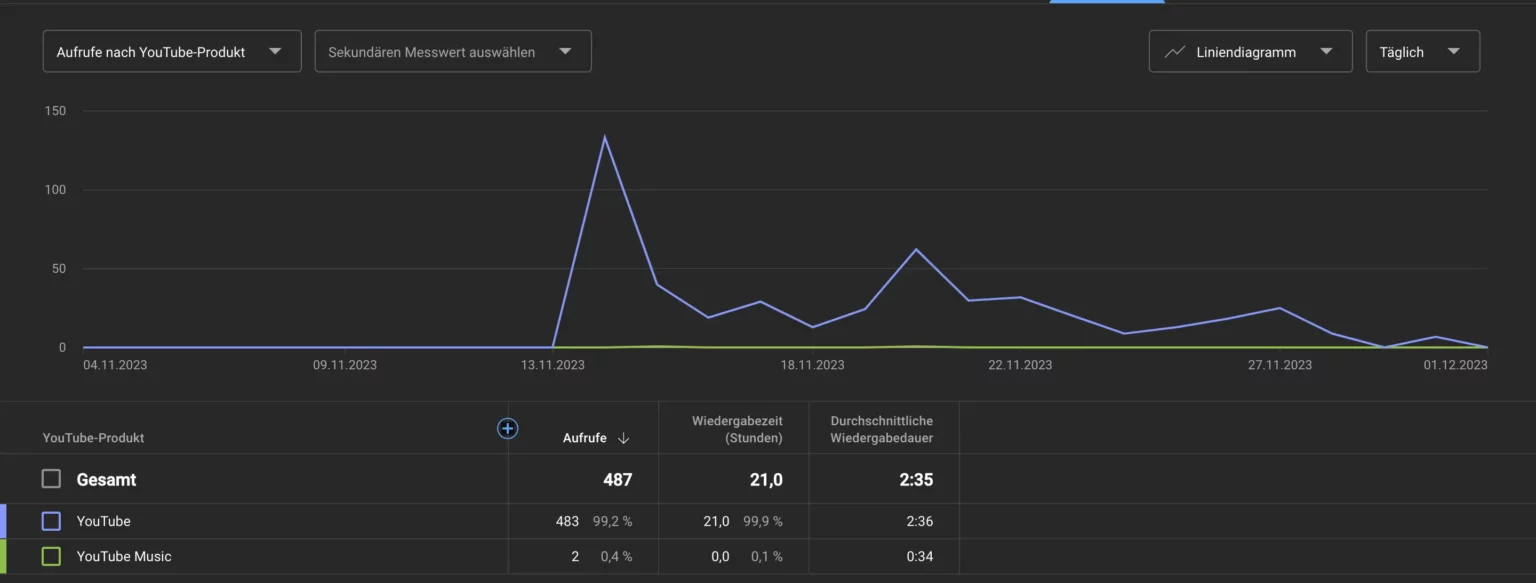
In advanced mode you can display views by YouTube product. Then you see how much runs via YouTube and how much via YouTube Music. How to grow your podcast on YouTube is in the article on podcast reach on YouTube.
How many listeners does a podcast have? Benchmarks
An average podcast has fewer listeners than most people think. At the host Buzzsprout, an episode with 27 downloads in the first seven days is already in the better half of all podcasts. With over 400 downloads in the first week you belong to the top 10 %.
| Downloads of an episode in the first 7 days | That puts you in the |
|---|---|
| from 27 | top 50 % |
| from 96 | top 25 % |
| from 412 | top 10 % |
| from 1,007 | top 5 % |
| from 4,586 | top 1 % |
Source Buzzsprout, as of September 2026. Applies only to podcasts hosted there and changes slightly every month.
I find these numbers reassuring every time. Whoever starts with 50 listeners per episode is already ahead of the majority. With a business podcast, what matters above all is who is listening. 50 listeners who belong exactly to your target audience bring you more than 5,000 random ones.
So compare yourself above all with yourself. Take the downloads of every episode after exactly seven days, then you compare fairly, no matter when an episode was released.
The three numbers that really count
With our clients, my team and I look above all at three numbers. Everything else is nice to know, but these three tell you whether your podcast works.
1. The retention rate, meaning how long your listeners stay
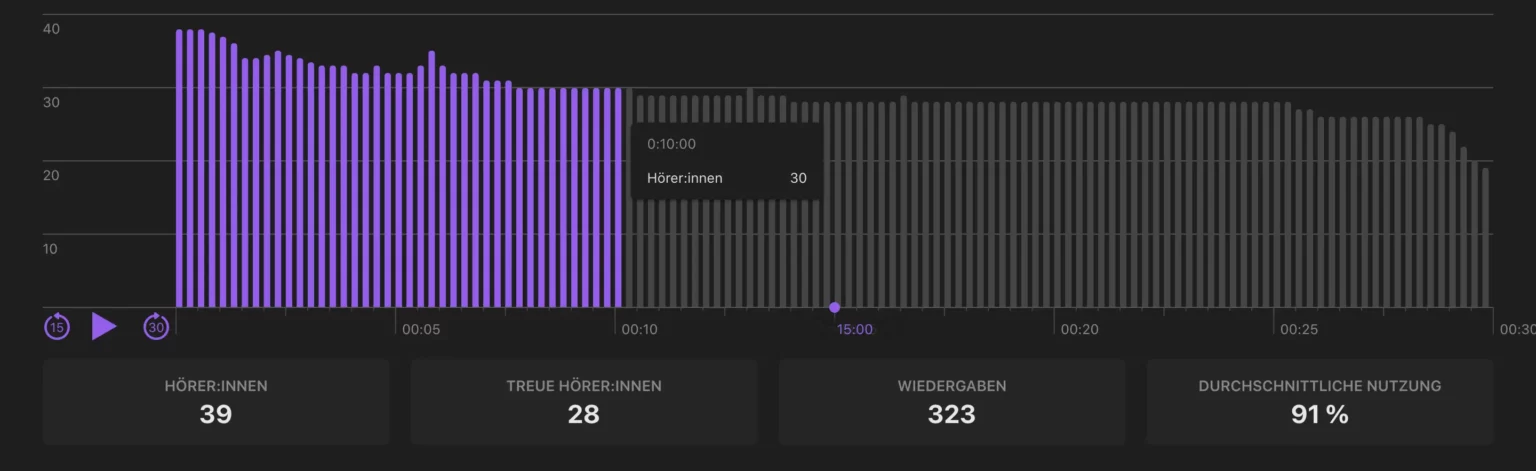
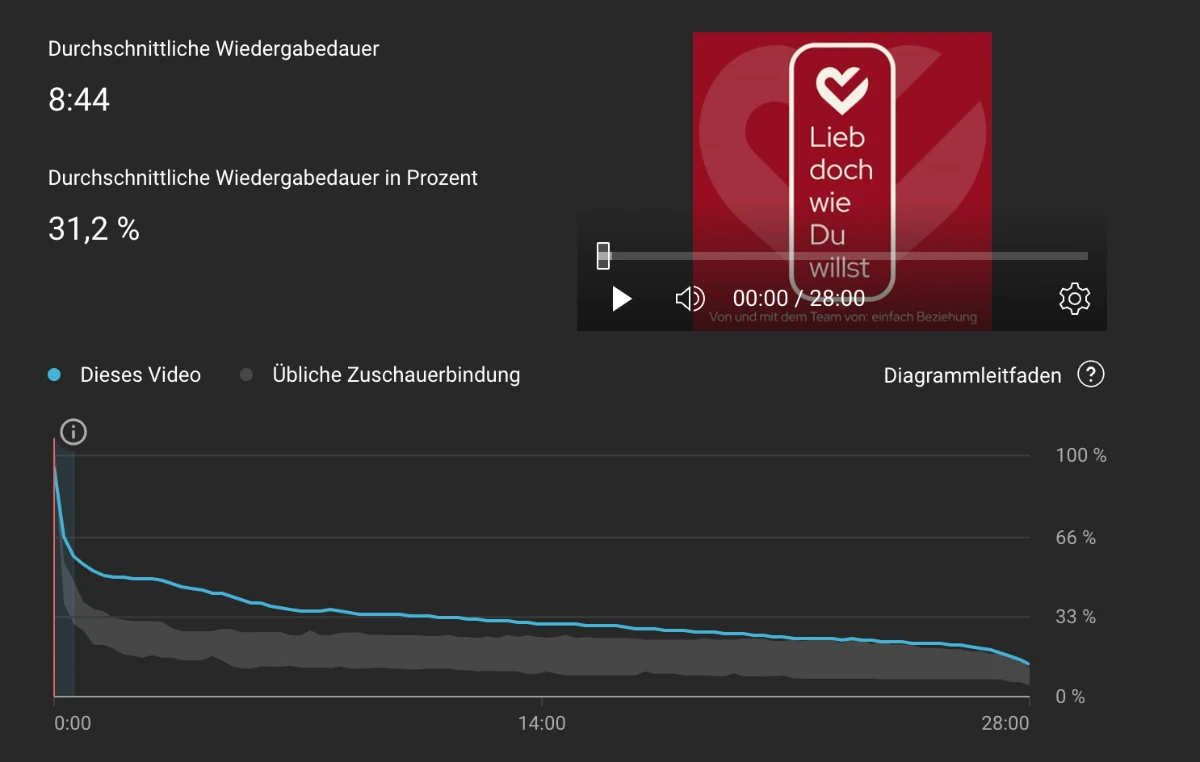
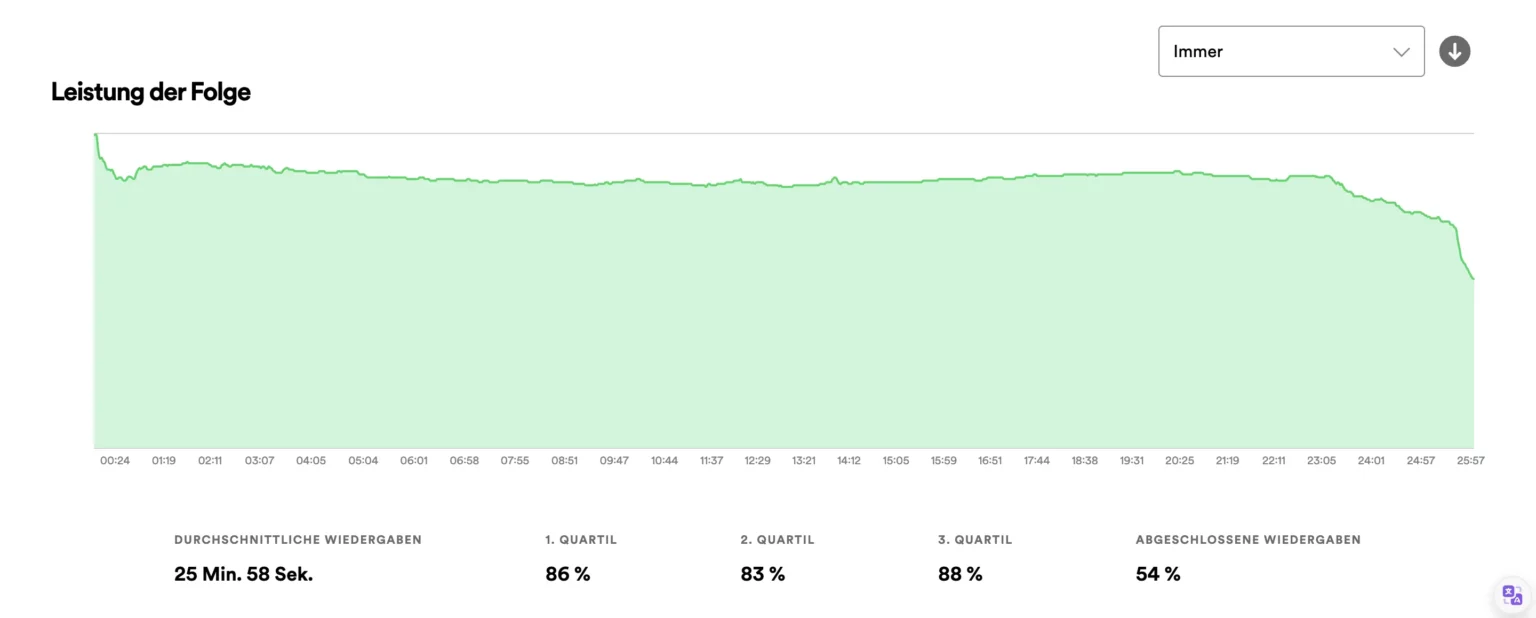
The retention rate shows you as a curve what percentage of your listeners are still listening at each point of an episode. It is the most honest number there is, because a download can happen by chance, staying cannot. From the curve you see whether the intro is too long, where the conversation drags and whether your episodes are too long overall.
You find it on Spotify under “Episode performance”, on Apple in the analysis of every episode and on YouTube under “Key moments for audience retention”. Most hosts do not have it or only in the expensive plan. Look at the curve across several episodes before drawing conclusions, a single episode can be an outlier.
2. Listeners and downloads per episode
The total number of your downloads always grows, even if your podcast is stagnating. More meaningful is how many listeners a single episode reaches. That shows you which topics and guests pull. If one episode beats all others, look at it closely: topic, title, guest and length, and do more of that. How to plan such topics deliberately is in the article on the podcast editorial calendar.
3. The numbers of the last 90 days
For your podcast’s development we look at the last 90 days. A single day or week fluctuates too much; holidays, vacation or a guest with a big reach distort the picture. 90 days are long enough to see a real trend, and short enough to still react. Compare them with the 90 days before, then you know whether you are growing, stagnating or losing listeners.
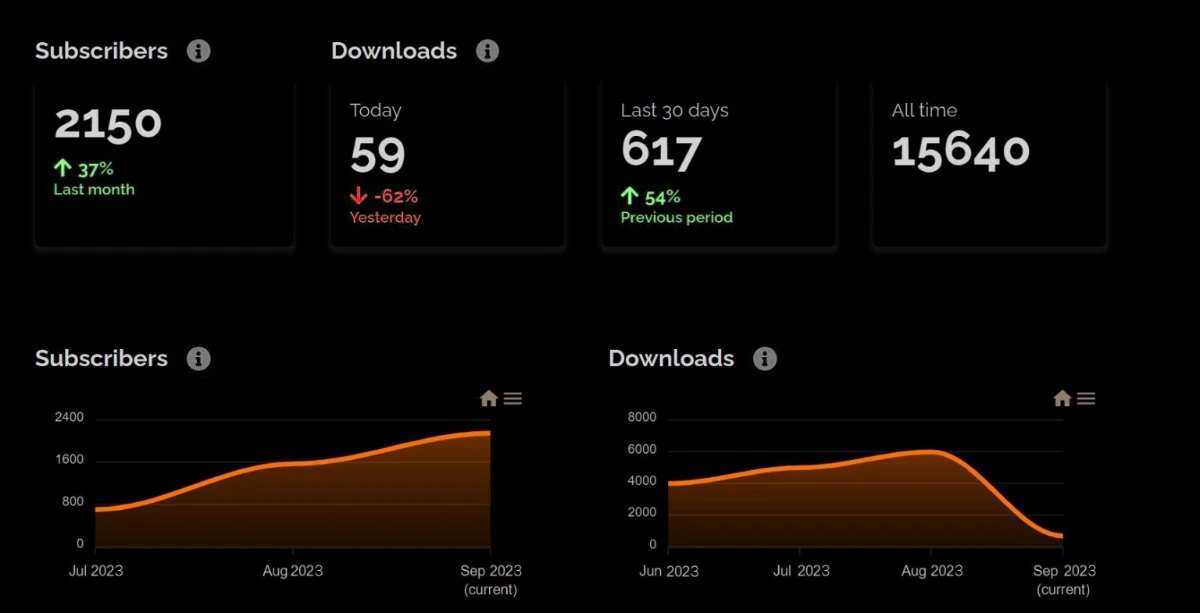
And do not be fooled by zoomed-in charts. Depending on the chosen period, the same development looks great or miserable.
How the podcast charts work
Charts do not show which podcast has the most listeners, Apple even says so itself. The Apple Podcasts charts are calculated from a mix of listening, new followers and completion rate, meaning how many listen to an episode to the end. Ratings and reviews explicitly do not count. Only what happens in the Apple Podcasts app is counted, and every country has its own charts.
Because above all new followers of the last few days count, a podcast with a good launch campaign can briefly jump into the charts without having many listeners. So if someone promises you “number 1 in the charts”, ask for how long and in which category.
On Spotify, the top podcasts result, according to Spotify , from the number of followers and the number of recent listeners. The top episodes depend solely on how many individual listeners they had on the respective day.
Bonus
How to read your retention curve
The line I talked about at the start is the retention curve. With a little practice you read it like an X-ray of your episode, and four shapes keep appearing.
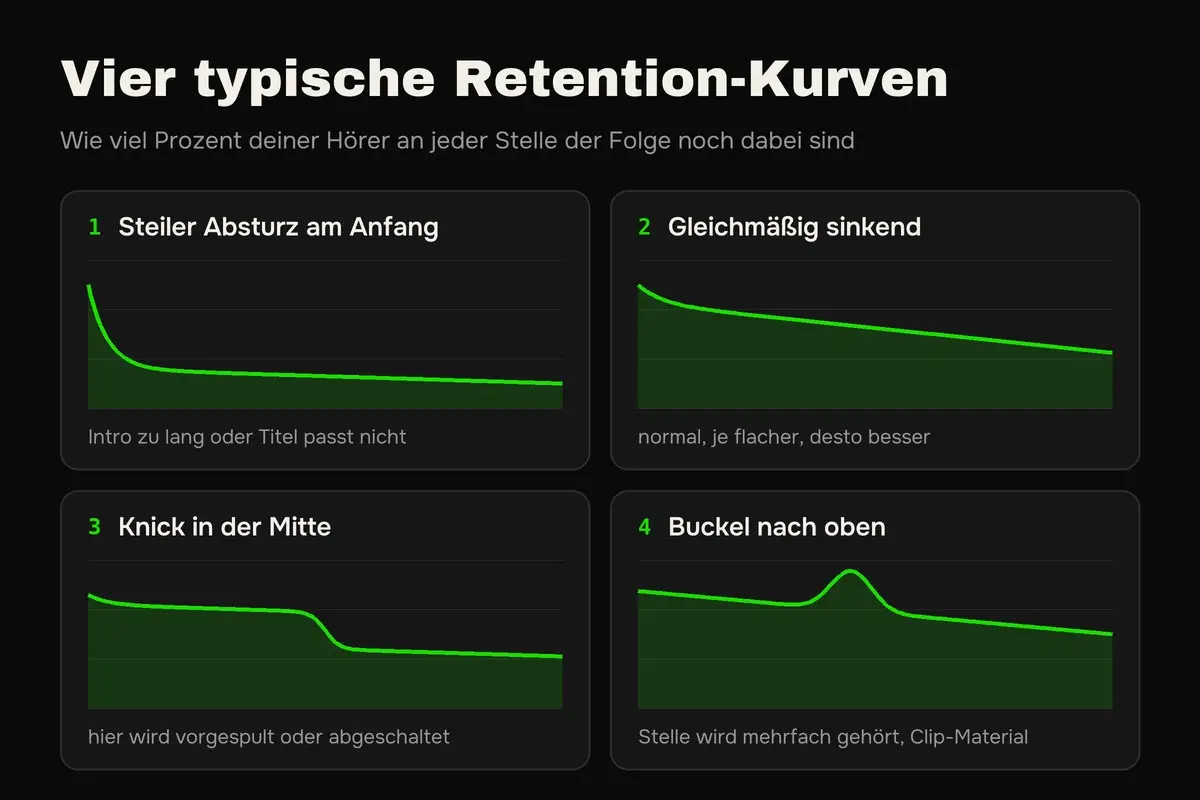
1. Steep drop at the start: Many leave before it really gets going. Usually the intro is too long, or the title promised something other than what the first sentences deliver. Start directly with the most exciting thought of the episode.
2. Evenly declining: That is normal, every curve falls. The flatter it falls, the better. Compare the slope across several episodes, then you know which formats carry.
3. Dip in the middle: At a certain point many drop off or skip ahead. Listen to exactly that minute again. Often it is an ad break, a change of topic or a passage that drags.
4. Bump upwards: The curve rises, sometimes even above 100 %. That means people rewind and listen to a passage again. Exactly this moment is a perfect clip for Instagram, TikTok or YouTube Shorts.
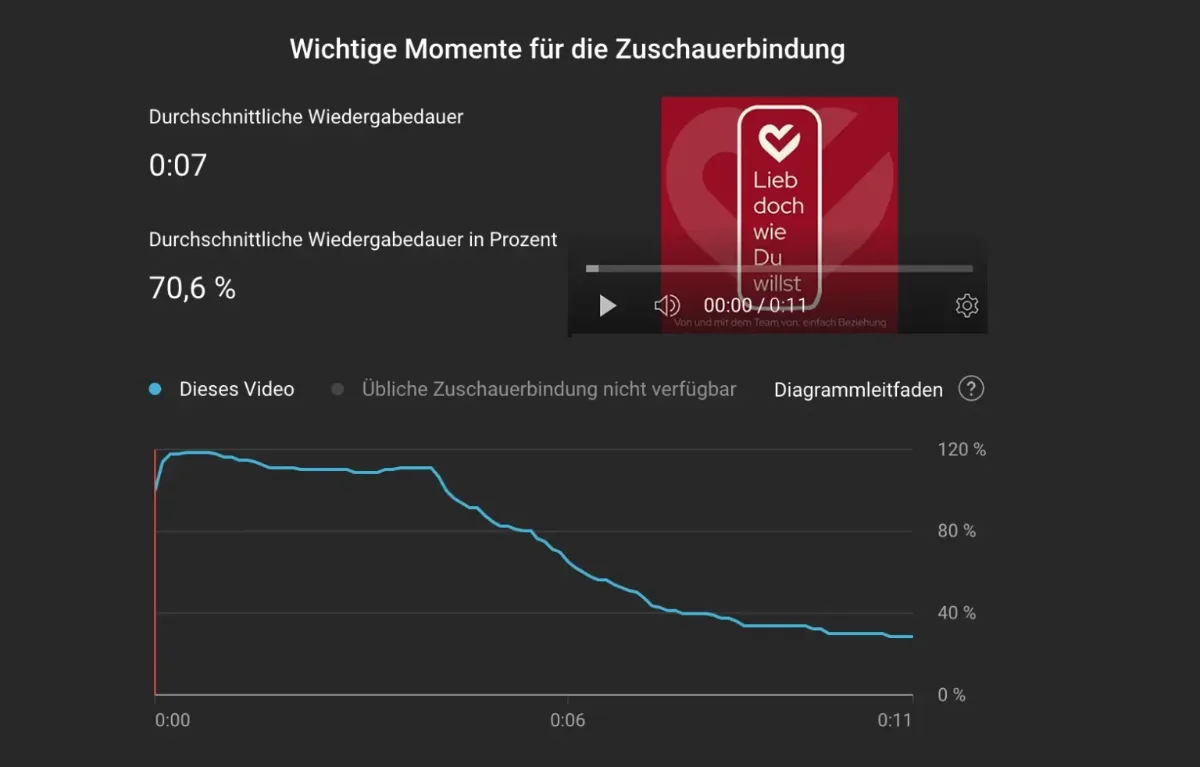
This is what a bump looks like in YouTube Studio: the first seconds were watched more often than there were viewers.
My tip: once a month, look at the curves of your last episodes side by side. After three or four months you recognize patterns that no download number would ever show you.
Conclusion on podcast statistics
Podcast statistics seem confusing because every platform counts something different. Your host shows you total reach in downloads, Apple, Spotify and YouTube show you how people really listen. If you keep three numbers in view, the retention rate, listeners per episode and the trend over the last 90 days, you always know whether your podcast works and where to start.
Frequently asked questions about podcast statistics
You see total reach at your host, where downloads across all platforms are listed. How many individual listeners you have on Apple and Spotify is shown by Apple Podcasts Connect and Spotify for Creators. There is no exact total, because every platform counts differently.
According to the numbers of the host Buzzsprout, an episode with 27 downloads in the first seven days is already in the better half of all podcasts, from 412 downloads in the top 10 % (as of September 2026). For a business podcast, though, what matters above all is whether the right people are listening.
Spotify only counts plays in its own app, and since June 2026 only from 30 seconds. Your host, on the other hand, counts downloads from all apps, including automatic ones. Both numbers are correct, they just measure different things.
You never see names. Spotify shows you age, gender and country of your listeners, Apple and your host show you countries, apps and devices. You only learn more if listeners write to you themselves.
There is no fixed threshold, because length and format of episodes are so different. Compare your episodes with each other and pay attention to where the curve falls. YouTube additionally shows you the typical retention of comparable videos, and Apple counts everyone who hears 40 % of an episode as an engaged listener.